The road to continuous VA/NVA measurement
Movement is data.
Waste requires context.
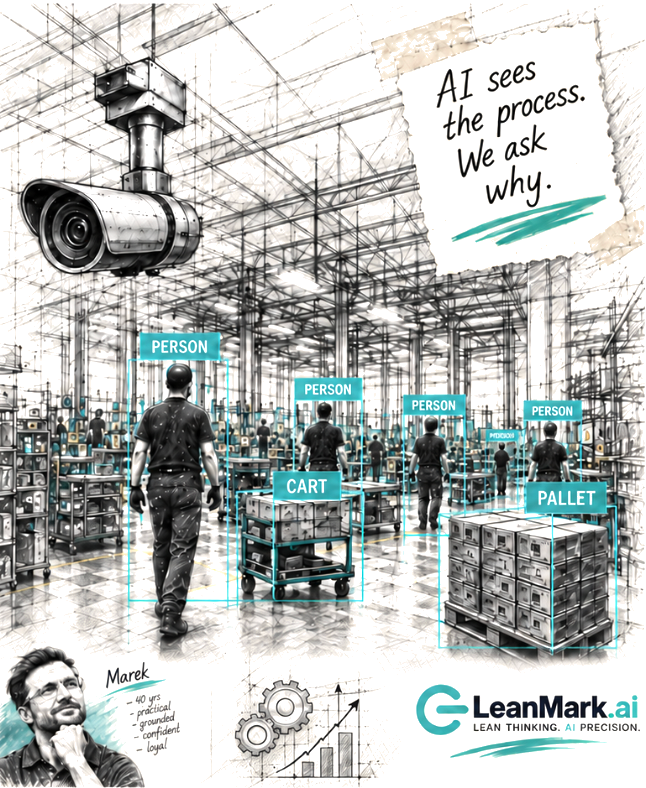
AI sees the process. We ask why.
The machine that looked perfect
A camera over our edge bender would have scored it 100% value-added. The machine ran all day, every day, and it was building the problem.
That edge bender bent 200 panel edges a day. We shipped 70.
The other 130 went onto a stack and waited days to have the second side done. Gary Connor, the lean expert who trained me, walked past it and asked why it was running at all. Nobody had asked before, because the machine had always run.
A camera pointed at that station would have recorded an operator working, a machine cycling, parts moving. Every frame counts as work.
The waste was in the
stack behind it.
02 / What the technology already does
The floor is becoming machine-readable
I watched a 20 second warehouse CCTV clip run through a vision model this week. The interesting part was the bookkeeping, not the boxes on screen.
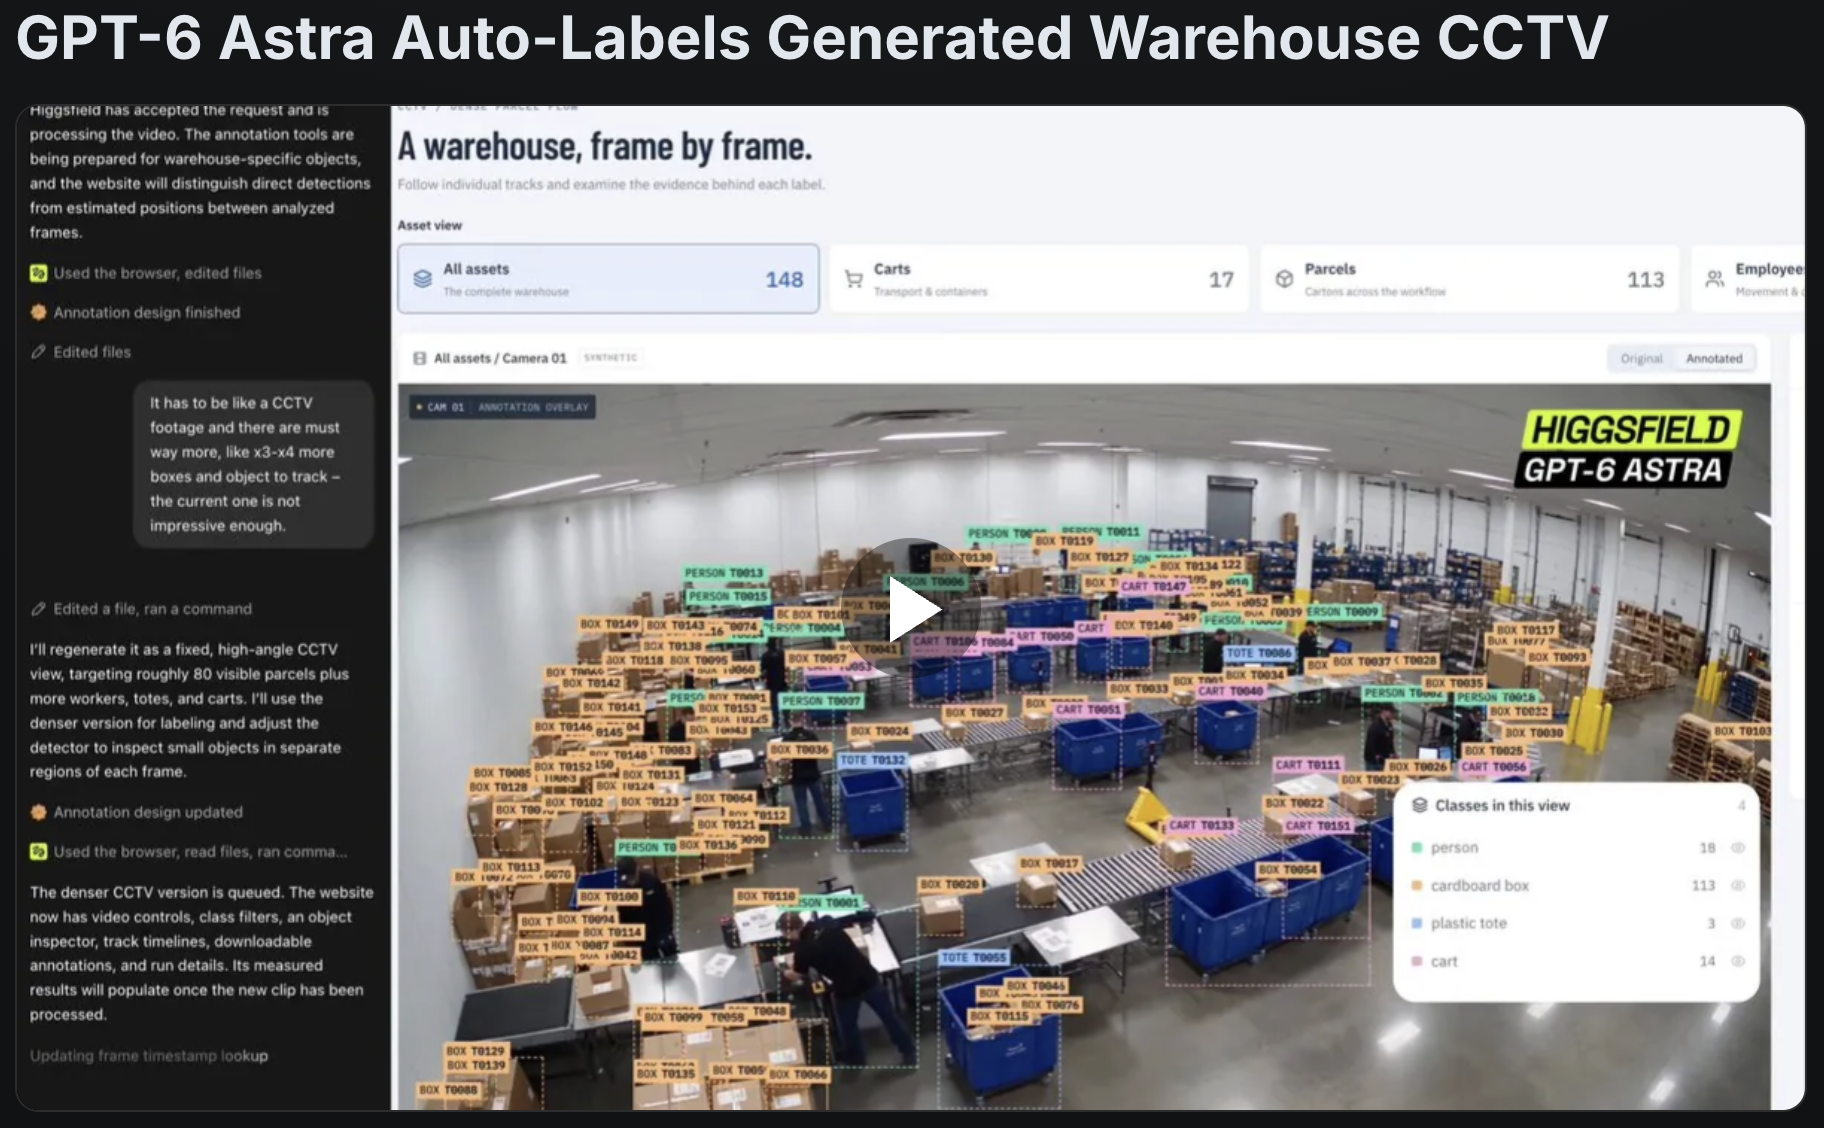
Every object gets an ID and keeps it across the clip. The tool separates positions it actually detected from positions it estimated between analyzed frames, and it writes down which tracks it is unsure about.
So the physical space starts answering questions in a form software can use. What is here. Where is it. Where did it move. How long was it there. What was next to it.
That is the bottom of the ladder, and it is real today.
03 / Where the ratio actually hides
The waiting happens off camera
When we mapped the whole flow at the partition plant, one panel took 21 minutes of work and 11 days of lead time. One minute of work for every 38 minutes of waiting.
After we redesigned the operation into 9,000 square feet, lead time came down to effectively 2 days. We never formally re-measured the ratio, so treat the post-move ratio as inferred rather than measured.
Almost none of that waiting happened in front of a workstation. It happened on a stack, overnight, between two operations, in an aisle. A vision model watching the busiest station in that plant would have reported a busy station.
| Layout | Work time | Lead time |
|---|---|---|
| Before 15,000 sq ft | 21 min | 11 days |
| After 9,000 sq ft | 17 min | ~2 days |
Measurement notes
Work time and lead time are my own measurements. The reported before ratio was 1:38. The post-move 1:8 figure is inferred from the lead time and was never formally re-measured.
04 / The limit worth naming
A camera sees motion.
Waste is a judgment about why.
Suppose the system watches an operator leave his station 11 times in a shift and walk 60 feet each time. That is a measurement. Whether it is waste depends on where he went and why.
- For material that should have been at the point of use.
- For a tool that belongs in the drawer behind him.
- For a print nobody attached to the job.
- To carry a finished part to the next operation, which the standard work requires.
Same movement on camera, four different problems, and only some of them are the layout's fault.
05 / The road to a VA/NVA ratio
Seven rungs, and we are on the second
From pixels to a decision — where the technology stands today:
- See the objectsReal now
- Track them over timeReal now
- Recognize the activityGetting close
- The process context starts hereAdd process contextOpen
- Classify VA, necessary NVA, NVAOpen
- Name the waste and the causeOpen
- Walk out and fix itHuman
Rungs 1 and 2 are what the demo does. Everything above the gap needs the expected sequence, standard work, station boundaries, machine states, takt, and whether the step changes the product in a way the customer pays for.
06 / What it would look like on a Monday
The number that changes the management question
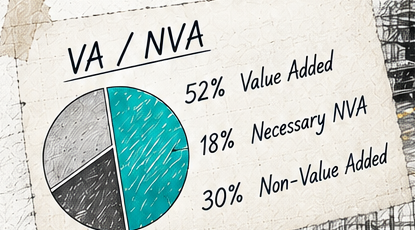
- Value added
- Necessary NVA
- NVA
Of the shift: waiting 12% · walking 6% · searching 5% · transport 4% · rehandling 3%.
Nothing here was measured. It shows the shape of the output a continuous VA/NVA reading would produce, so the argument about what to do with it can start.
Asking an operator at 52% to work faster gets you a tired operator at 52%. Moving that station to 60% is a design job, and it belongs to whoever owns material presentation, layout and the schedule.
07 / What the camera is for
It tells you where to walk
On a traditional time study I watch maybe 10 cycles and write down what I see. A camera can watch the whole shift, every shift. That difference is the entire argument for building this.
And it only pays off if somebody walks out there afterward. If a system told me station 17 lost 74 minutes to material waiting yesterday, my next move would be to stand at station 17 and watch, not to send the operator a warning.
The value stream still gets mapped by somebody standing in it.
08 / Worth taking to the floor
The three rules I am starting with
- 01
Movement is data.
Waste requires context. - 02
Diagnose the process,
never the person. - 03
Automated Gemba tells you where to go.
It does not go for you.
This is #01. Every Monday I take one tool, paper or demo and ask the same thing: does it move us closer to knowing where value stops flowing, and why?
One question for Monday
Pick one part you shipped last week. How many minutes of work went into it, and how many days did it sit in your building?
If you have the second number, where did it come from?
The floor tells the truth.
Marek