I want to spend less time collecting seconds and more time understanding where they go.
That is why this next step in Automated Gemba interests me so much.
In Episode 01, I looked at a warehouse demo that detected objects and followed them across frames. People, carts, parcels. A record of what moved, where it went and when.
Now I want to move closer to the work itself.
Can a system recognize the sequence at a station? Separate assembly from handling, walking and waiting? Put a time against each activity and give us something we can actually improve?
This is another step toward my idée fixe: continuous VA/NVA measurement through smart cameras.
The stopwatch disappearing is the visible change. What excites me is the time that could give us back to understand the process.
01 / The technology
From a video to a time study
This week’s example is Kaizen Copilot from Retrocausal.
According to its product documentation, the software takes a workstation video, separates the process into steps, measures their duration and proposes value-added, necessary non-value-added and non-value-added classifications. It also provides workstation improvement recommendations. These are the manufacturer’s stated capabilities; their accuracy on a particular process needs to be checked against that process. See the time-study workflow and video.
The platform also connects task times to line balancing and Yamazumi charts. Explore Kaizen Copilot and its three-minute overview.
That takes us beyond the warehouse tracking example and onto the third rung of the ladder from Episode 01: recognizing the activity. The software can also propose a value classification. I would still review that classification with someone who understands the process.
I can see the appeal immediately: record the work, review the breakdown with the operator, test an improvement and repeat the study.
A shorter path from observation to an experiment on the floor.
02 / Reading the time
The 84-second cycle
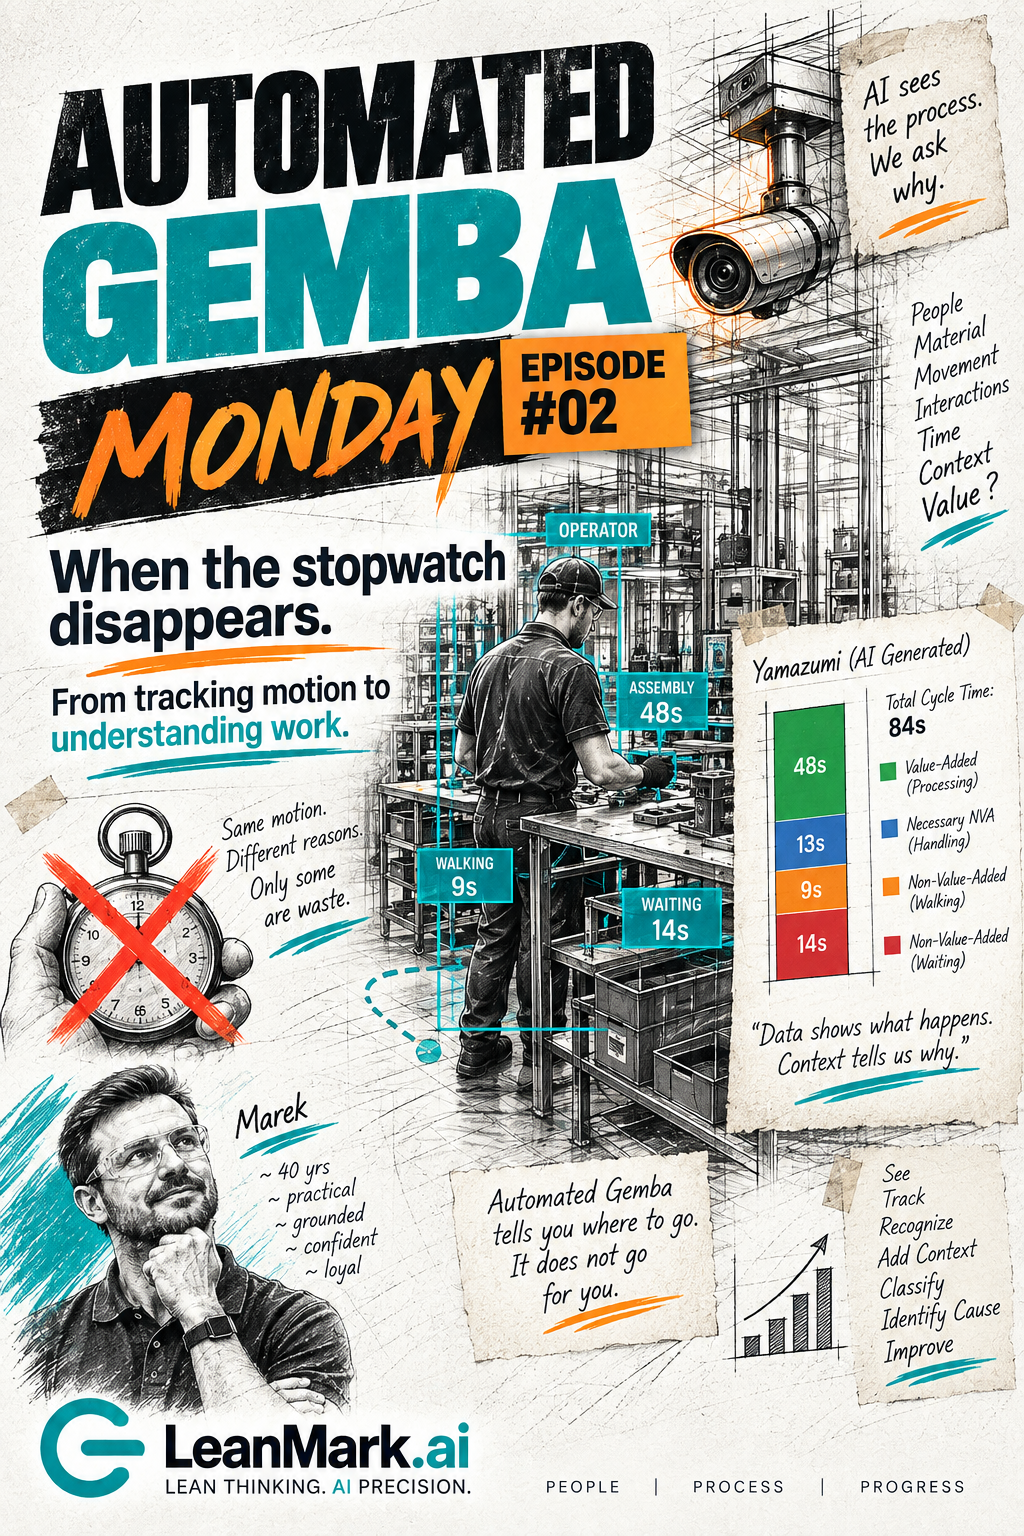
Look at the example in this episode’s illustration:
- Assembly 48s
- Proposed: value-added
- Handling 13s
- Proposed: necessary NVA
- Walking 9s
- Proposed: non-value-added
- Waiting 14s
- Proposed: non-value-added
Illustration, not a measurement. These are example numbers, not output from Kaizen Copilot. Activities are assumed to be sequential, with no overlap. The classifications need process context.
Under those assumptions, value-added work occupies about 57% of the observed cycle.
That gives us a useful place to start. But before accepting that number, I want to know what earned those 48 seconds their green label.
Was the operator assembling a product the customer needed? Was it done correctly the first time? Or was some of that movement repairing an earlier mistake?
Then I want to understand the other 36 seconds. What was being handled? Where did the operator walk? What were they waiting for?
Those answers determine the improvement.
Measuring the seconds gives us the size of the opportunity. Understanding the work tells us what to change.
03 / A story from our floor
The walk that kept the line running
Fausto ran our floor.
After the move into 9,000 square feet, his job changed from pushing people to watching the flow. One moment captured that change better than any chart could.
The sandwich station was running low on glue. The next bucket was somewhere in a 150,000-square-foot building.
Fausto saw it coming, walked a bucket over, and the line never paused.
Nobody noticed. There was no interruption to notice.
In the old system, we lost about 20 minutes a shift searching for things. That walk was part of what replaced the searching: somebody watching what the process would need next and getting it there before the work stopped.
A camera could record the walk and identify the bucket being carried. A simple classification rule might put it into transport, color it orange and flag it for elimination.
The movement would be recorded correctly. The recommendation could still be wrong.
Carrying the glue did not add value to the product. In those conditions, it helped keep value flowing.
Removing that walk without changing how glue reached the station would bring the shortage back.
That does not make the walk untouchable. I would want to investigate a better point-of-use supply and a replenishment signal, so keeping the line running depended less on Fausto noticing the bucket was almost empty.
But that is a process change. We have to understand the job the walk was doing before we try to remove it.
Before removing a movement, understand what would stop happening without it.
This is the distinction I want Automated Gemba to help us investigate. Lean separates value-creating work from necessary non-value-added activity and avoidable waste. Necessary under the current design does not mean necessary forever. Lean Enterprise Institute explains these categories.
The video gives us something to review. Fausto's knowledge explains why that particular movement mattered.
Data shows what happens. Context tells us why.
04 / Beyond the colors
The chart is where the conversation starts
A Yamazumi chart stacks work elements so we can compare operator workloads with takt time and consider how to distribute the work. See the Lean Enterprise Institute’s operator balance chart definition.
Our single 84-second bar is a starting illustration. To make a line-balancing decision, I would also want the neighboring stations, the required sequence and the pace customer demand requires.
I would want several representative cycles, too. A clean cycle and a cycle interrupted by missing material tell different stories. I want to understand that variation before turning one observation into a target.
And I would keep one lesson from Episode 01 in view: a station’s VA percentage is not the product’s end-to-end VA percentage.
We could improve this station and still leave its output waiting two days for the next operation. My edge-bender example is exactly why I keep coming back to that distinction.
The continuous VA/NVA picture I want will need to connect activity at the station with what happens to the material between stations.
05 / One practical experiment
What I would do with it on Monday
I would start with one repeatable operation and one question the team already cares about. Perhaps material searching, repeated handling or an unexplained wait.
Then I would:
- Record several representative cycles with the operator involved and the purpose understood.
- Review the proposed activity boundaries and VA/NVA labels together, keeping uncertain segments visible.
- Choose one process change: move a bin, separate similar parts, improve replenishment or change the work sequence.
- Repeat the observation and check whether flow improved while quality and safe working conditions were maintained.
That is the experiment I want. Something small enough to understand and concrete enough to learn from.
If the system finds repeated waiting, my next move is to investigate what the process failed to provide.
The person in the frame should help us understand the result. Their knowledge belongs in the analysis.
This is where I see the promise of Automated Gemba: less effort spent preparing the study, more opportunity to test improvements with the people doing the work.
The stopwatch may disappear from our hands. The responsibility to understand what we are measuring stays with us.
06 / Your turn
One question for Monday
What is the one movement in your plant that looks like waste on camera, but helps keep the line running?
What would you have to change in the process before that movement could safely disappear?
AI sees the process. We ask why.
The floor tells the truth.
MarekContinue the conversation
Every floor has a story like Fausto’s.
I’d like to hear yours. Find me on LinkedIn and tell me about the movement that keeps your process running.
inFind me on LinkedIn